|
|
Top Previous Next |
IndicatorsThis section describes how to use the technical Indicators available in TradeXpress to predict future price changes of stocks. Chart indicators are technical analysis tools which plot additional information onto a chart for the purpose of pin-pointing or predicting significant moments in the life of a data series. They are created by taking the underlying data values and applying them in a mathematical formula to produce a different series of values for plotting. Many indicators require input values to calculate properly.
In TradeXpress Chart the available indicators are categorized as follows: 1.Averages 2.Bands
PROCEDURE
To apply indicators:
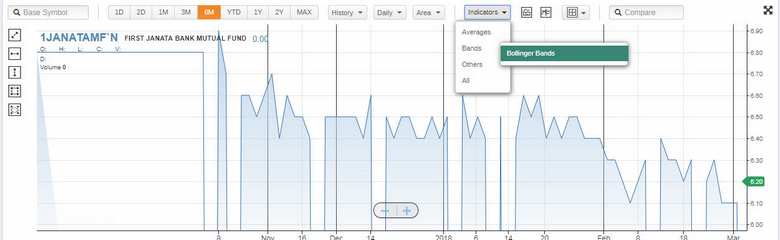
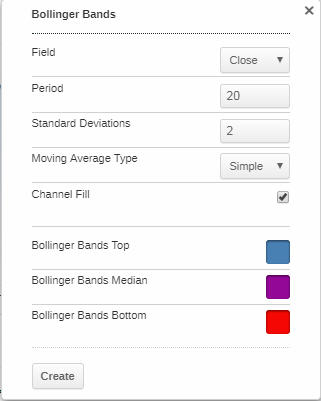
1.Click the arrowhead next to Indicators on the standard chart toolbar, click on the required indicator and edit the properties.
Figure 01- Apply Indicators
Figure 02- Indicator Properties
|